
Metrics
Metrics
Section titled “Metrics”The Metrics section is where you step back and look at the shape of your work over time, such as how many devices you are requesting, how long they take to reach the field, and how long deployments run. It is the view to bring to a capacity conversation or a client review, since you can scope it to a single client and a time range. The header reads Service Metrics.
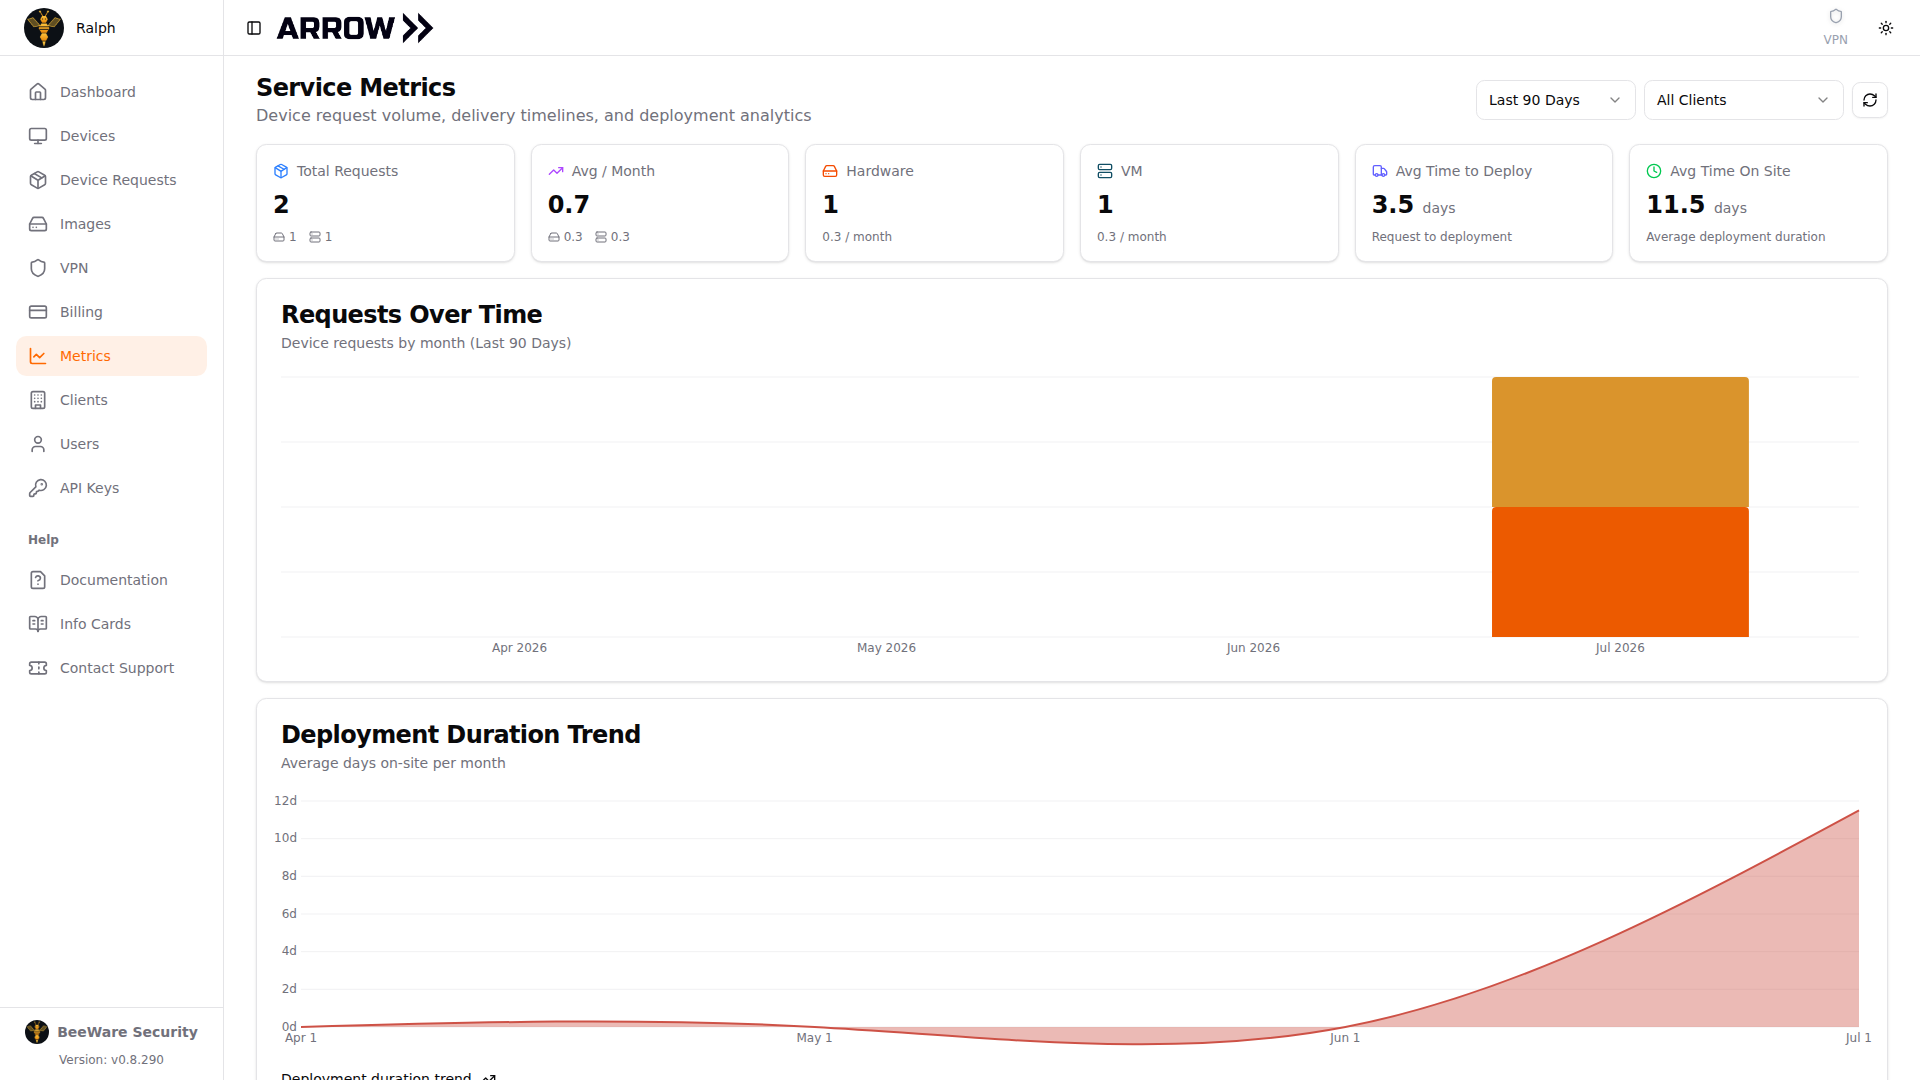
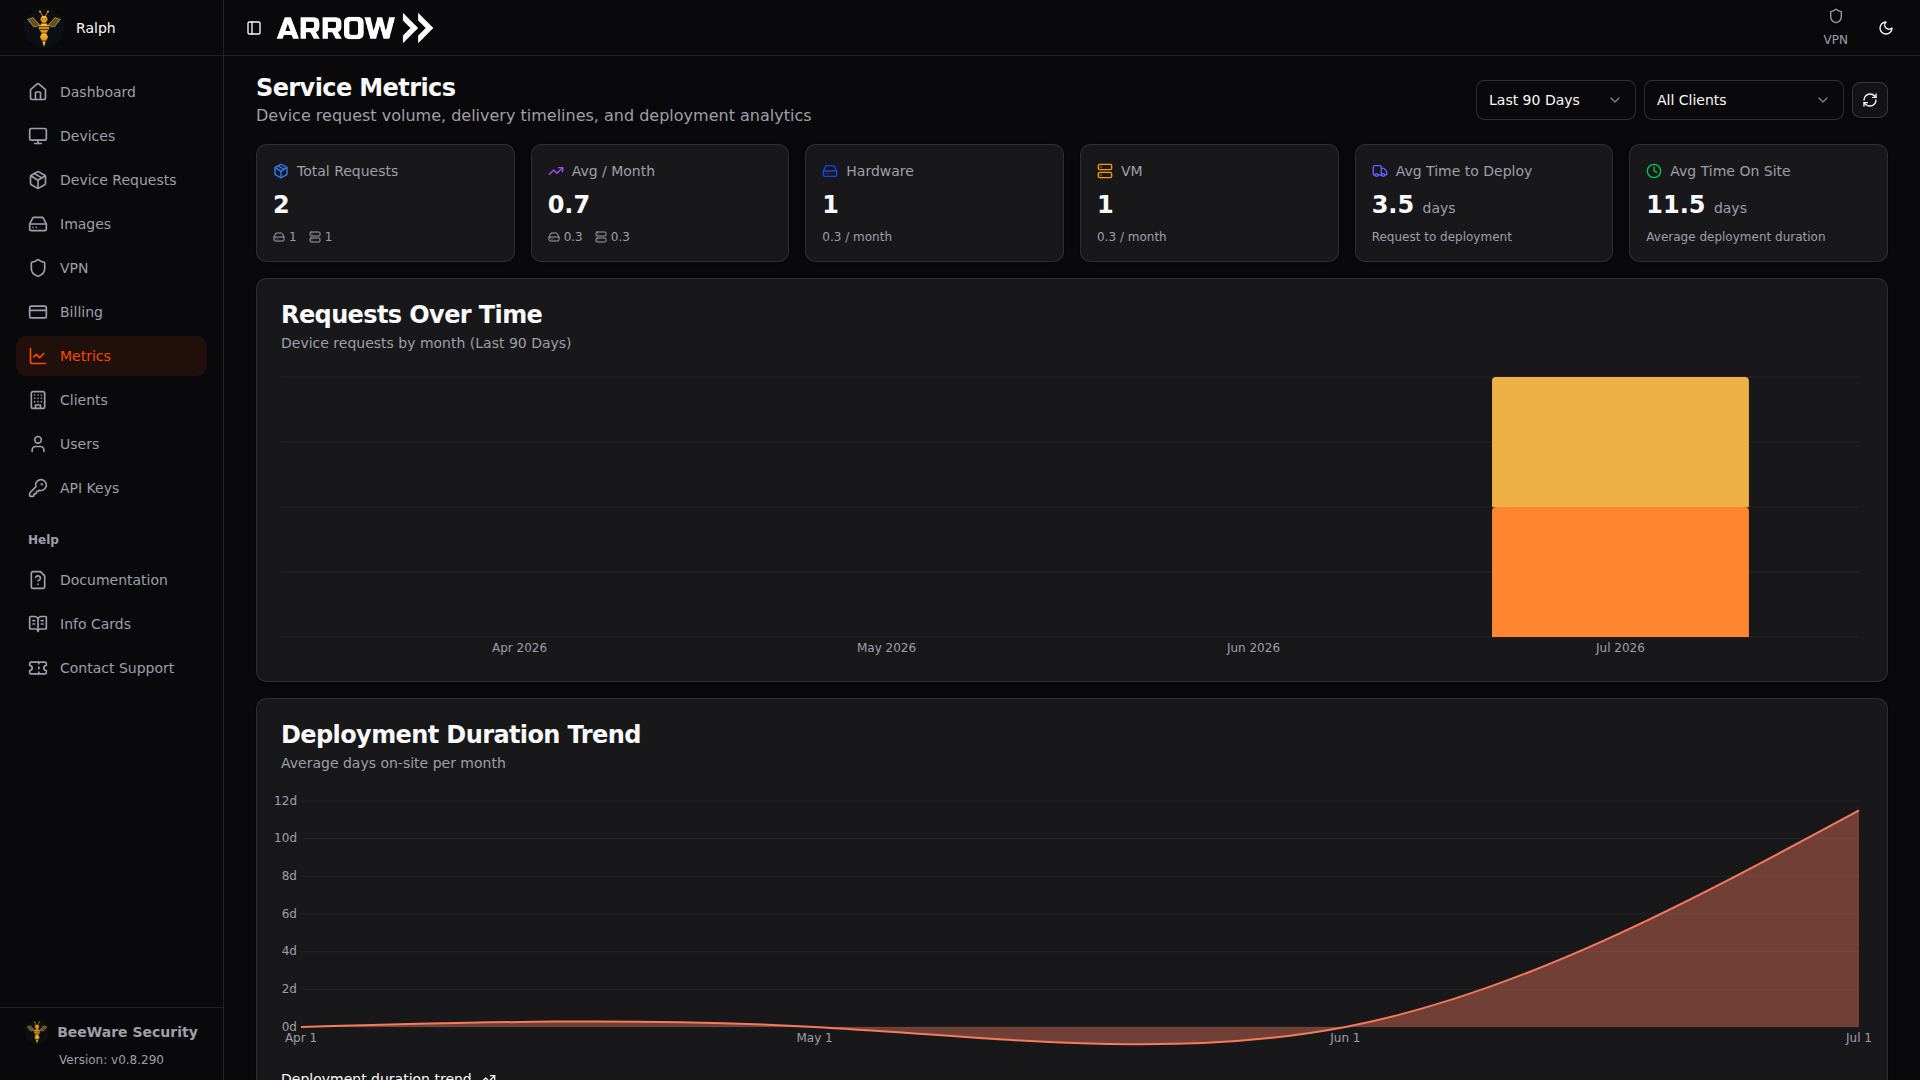
- 1 Scope every number below to a time range and to one client or all clients.
- 2 The headline numbers are total requests, the hardware and VM split, average time to deploy, and average days on site.
- 3 Requests over time, so you can see how your workload trends month to month.
- 4 How long deployments actually run on average, month over month.
The headline numbers
Section titled “The headline numbers”A row of cards across the top summarizes your activity for the selected range:
- Total Requests is your overall request count, split into hardware and VM.
- Avg / Month is the average requests per month, with the hardware and VM averages beneath.
- Hardware and VM each break out their own count and monthly average.
- Avg Time to Deploy is the average number of days from request to deployment, a good read on your provisioning and delivery pipeline.
- Avg Time On Site is how long a device typically stays deployed, in days.
The charts
Section titled “The charts”Two charts sit below the cards. Requests Over Time plots device requests by month, so you can see when your volume rose or fell. Deployment Duration Trend plots the average days on site per month, which is the one to watch if you want to know whether engagements are running longer or shorter over time.
Scoping the view
Section titled “Scoping the view”Two controls in the top right set the scope for everything on the page. Time range chooses how far back to report, over the last 30, 90, 180, or 365 days. Client reports across your whole organization when set to All Clients, or drills into a single client when you pick one. Use the refresh button next to the filters to reload the data.