
ARROW Manager Overview
ARROW Manager is the dashboard that lives on your ARROW device itself. It is the control panel for a single, deployed device. Open it in a browser and you can see whether the device is healthy and online, deploy virtual machines onto it, drop into a terminal, and adjust its settings, without touching a separate SSH client or another tool.
What is ARROW Manager?
Section titled “What is ARROW Manager?”Think of ARROW Manager as the device’s own front panel, served over the web. It is where you go when you want to know what one specific device is doing right now, and where you go to put it to work. From it you can:
- See device health at a glance, with CPU, memory, storage, and temperature
- Confirm the device is connected the way you expect, across network, cellular, and the NetBird VPN
- Verify the device can actually reach its VPN host, which is the check that tells you remote access will work
- See which route the device is currently reachable on, and why that route was chosen
- Deploy and manage virtual machines from a built-in app library
- Open a terminal on the device
- Change device settings such as network mode, cellular, drop mode, and appearance
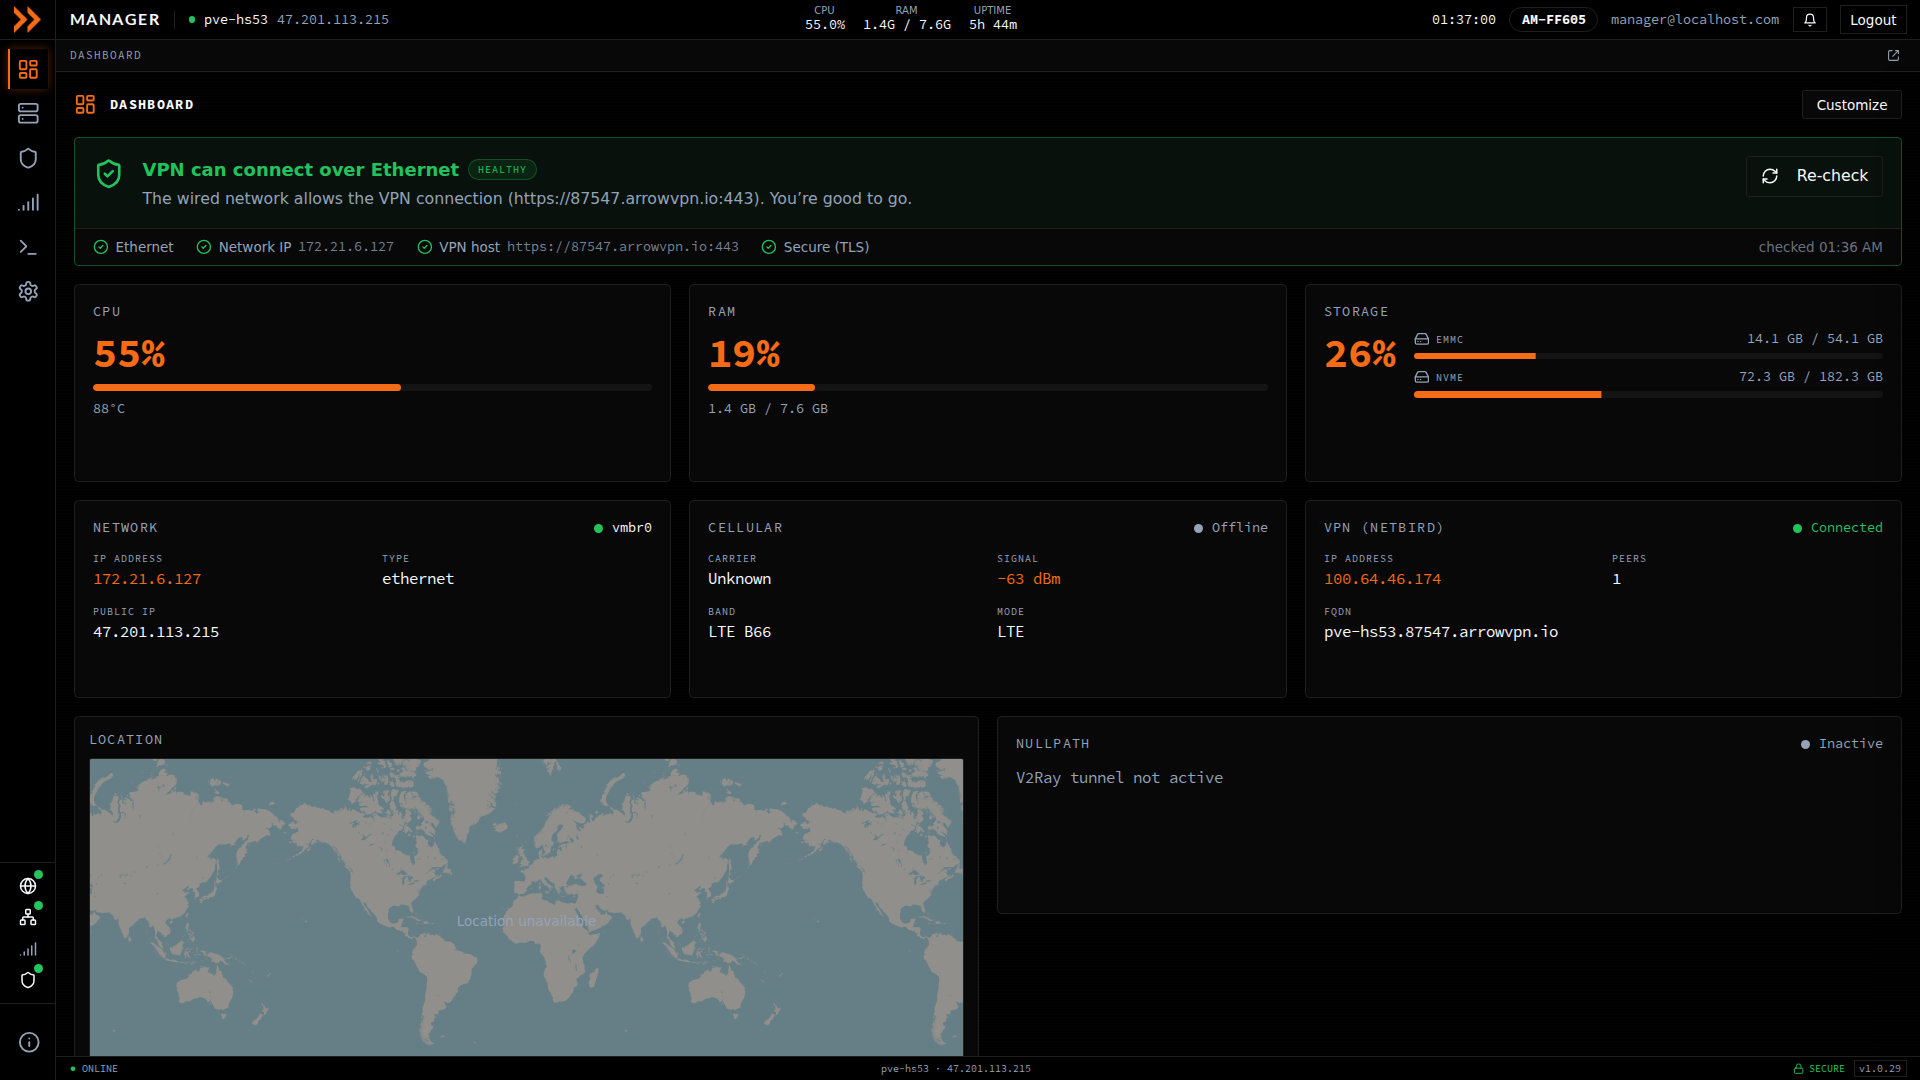
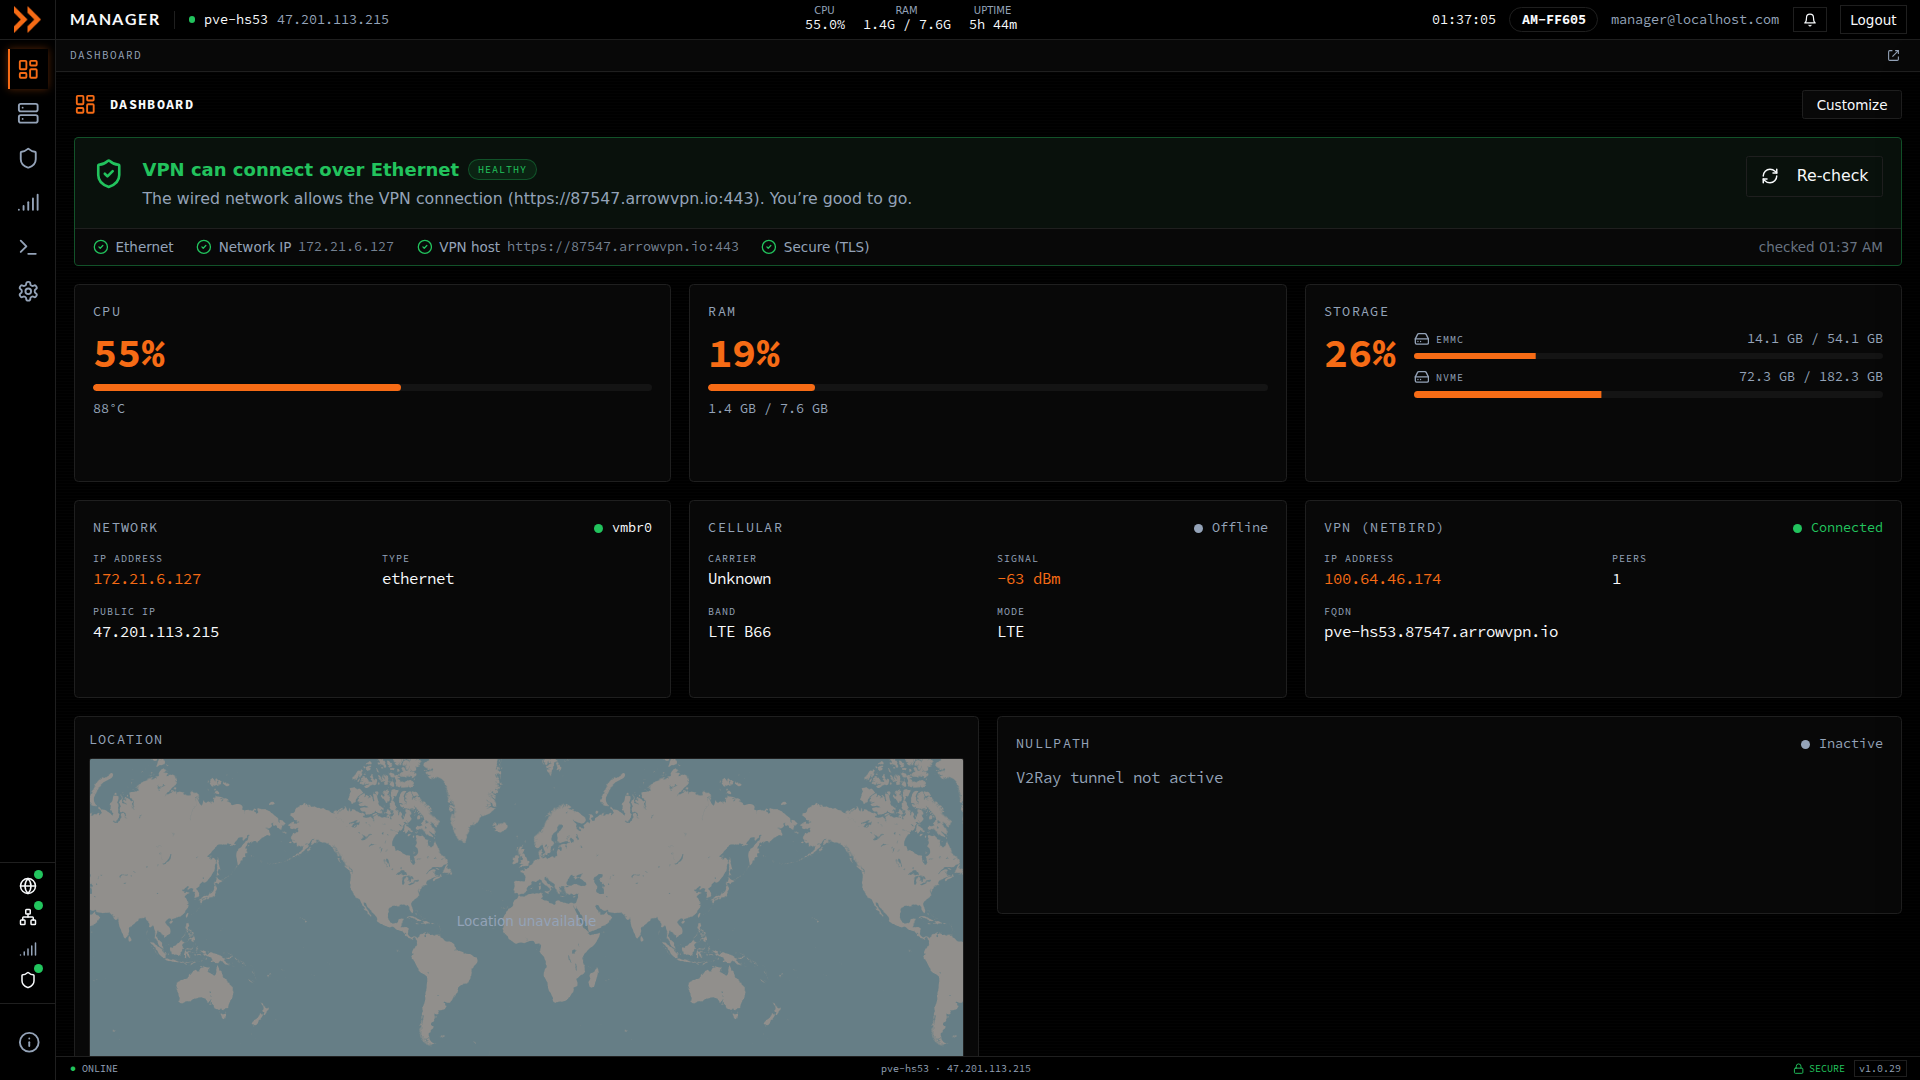
- 1 The health banner is the first thing to check, since it tells you in plain language whether the device can reach the VPN, and offers a re-check.
- 2 Live device resources, covering CPU (with temperature), memory, and storage usage.
- 3 Connectivity at a glance, covering the wired network, the cellular modem and signal, and the NetBird VPN with its address and peer count.
- 4 Where the device is on a map, and the Access path card naming the route the device is reachable on right now.
The Dashboard at a Glance
Section titled “The Dashboard at a Glance”The Dashboard is what you land on, and it is designed to answer one question fast. Is this device fine, or does it need me? A top bar runs across the screen with the device hostname, live CPU, RAM, and uptime, the current time, your device tag, your signed-in account, and a Logout button.
VPN Connectivity Health Banner
Section titled “VPN Connectivity Health Banner”Start here. The health banner at the top of the Dashboard tells you whether the device can reach its VPN host, which is the single most useful signal that remote access is working. When all is well it reads “VPN can connect over Ethernet” with a green HEALTHY badge and shows the individual checks it ran, which are Ethernet, Network IP, VPN host, and Secure (TLS). If any of those fail, this is where you see it first. Click Re-check after you have changed something, and it runs a full set of connection tests and opens the results in a VPN Connection Diagnostics window you can move, resize, or minimize while you keep working. When Secure (TLS) fails because the site is decrypting traffic, the TLS / Security section of those results names the SSL inspection product that re-issued the certificate, says whether it decrypts every site or only the VPN host, and lists the certificate each site presented on the wired path, which is what you need when you ask the site to exempt the VPN host.
If the device has failed over to cellular, the badge reads ON LTE and the banner keeps reporting on the wired path, since that is the one that needs fixing, but a device that is online over LTE is not treated as an outage. When the wired checks all pass, the headline says the device is online via LTE and the wired VPN path is healthy, and the wire will be used again once it is restored. When the wired path is not usable, the headline says the device failed over to LTE and names why (no Ethernet link, no IP address, or the network blocking the VPN), and the detail says whether the VPN host is reachable over cellular, which is what decides whether anyone can reach the device right now. A fifth check, VPN host over cellular, appears alongside the wired ones and shows the answer over the path the device is actually using.
Drop mode changes what the banner asks. A dropped device is meant to run entirely on cellular and to stay off the network it is plugged into, so instead of reporting a blocked wired path the banner confirms the device is running on cellular by design, and the wired checks (VPN host and Secure (TLS)) show as not applicable rather than failures. The one thing it raises there is drop mode being engaged while the device is not actually on cellular, which means it is either unreachable or using a network it is not supposed to use.
Status Cards
Section titled “Status Cards”Below the banner, a row of cards break the device’s state down further:
| Card | What It Shows |
|---|---|
| CPU | Current processor load and temperature |
| RAM | Memory used out of total |
| Storage | Space used on each drive (for example eMMC and NVMe) |
| Network | Interface IP address, connection type, and public IP |
| Cellular | Carrier, signal strength, band, and mode |
| VPN (NetBird) | VPN IP address, connected peer count, and device FQDN |
A location map, an Access path card, and a Switch port card round out the view. If the default layout does not match how you work, click Customize to rearrange, resize, or hide cards; your layout is saved automatically, so you set it once.
The map is scoped to the current boot. A device works out where it is when it starts up and never carries a position across a restart, so a box that was just rebooted reads “Locating…” until its first scan of that boot lands, which takes up to 30 seconds. A precise fix needs at least three WiFi access points in range and a radio that is not serving a hotspot. Without them the device reports no location at all and the map reads “Location unavailable”, and the ARROW Portal places the device from its cellular serving cell instead. If the map stays empty, or the pin is nowhere near the site, open the Location section of Settings. Rescan runs the scan again, and the section shows each stage of the last scan and anything blocking a precise fix.
Access Path
Section titled “Access Path”The Access path card answers a different question from the health banner. Not “is the VPN healthy” but “which route is this device reachable on right now, and why that one”. It draws the current path as a line, from the uplink (Ethernet or LTE), through whatever is carrying it (NetBird or Nullpath), to the device, and states the reason underneath in a sentence. Next to the title it reads Connected when traffic is confirmed to be moving, and Unconfirmed when a route has been selected but nothing has proved it carries traffic yet.
Show more details opens a window that lists all the paths in preference order, wired NetBird first, then the Nullpath tunnel over the CDN, then cellular, and marks the one in use as Current. Under that list it notes that Bluetooth and the ARROW mobile app are the backup way to configure the device, and shows the device’s LAN address. The same window shows the device’s uplink, VPN, and gateway addresses along with the connections it currently has open, which saves you a terminal when you need to know what the device is actually talking to. Those endpoint details need an administrator account; without one the rest of the card still works.
Switch Port
Section titled “Switch Port”The Switch port card answers a question that matters before you deploy a VM: will the customer’s switch port accept a second MAC address? It names the switch and port the device is plugged into, as the switch advertises them, notes whether the port runs 802.1X, and gives a verdict: Accepts a second MAC address, Refuses a second MAC address, or Second MAC address not yet tested. A VM already holding an address on the client network counts as proof. Otherwise Test with the next VM’s MAC sends one probe from the address the next VM will use and reports the answer, with the request to make of the network team if the port refuses. See A VM Gets No Network Address for what the test does and why it asks before running on most switches.
Navigation
Section titled “Navigation”Everything else lives behind the icon rail down the left side of the screen. Each icon opens one section:
| Section | What You Can Do |
|---|---|
| Dashboard | Monitor device health and connectivity |
| Virtual Machines | Deploy, start, stop, and open consoles for VMs |
| VPN | View NetBird status, peers, relays, and identity |
| Cellular | Inspect LTE signal, tower, modem, and data usage |
| Terminal | Open an interactive shell on the device |
| Settings | Configure network, cellular, drop mode, location, monitoring, updates, and appearance |
Terminal
Section titled “Terminal”When you need a shell on the device, the built-in terminal saves you from opening a separate SSH client. It supports multiple tabbed sessions and an adjustable font size.
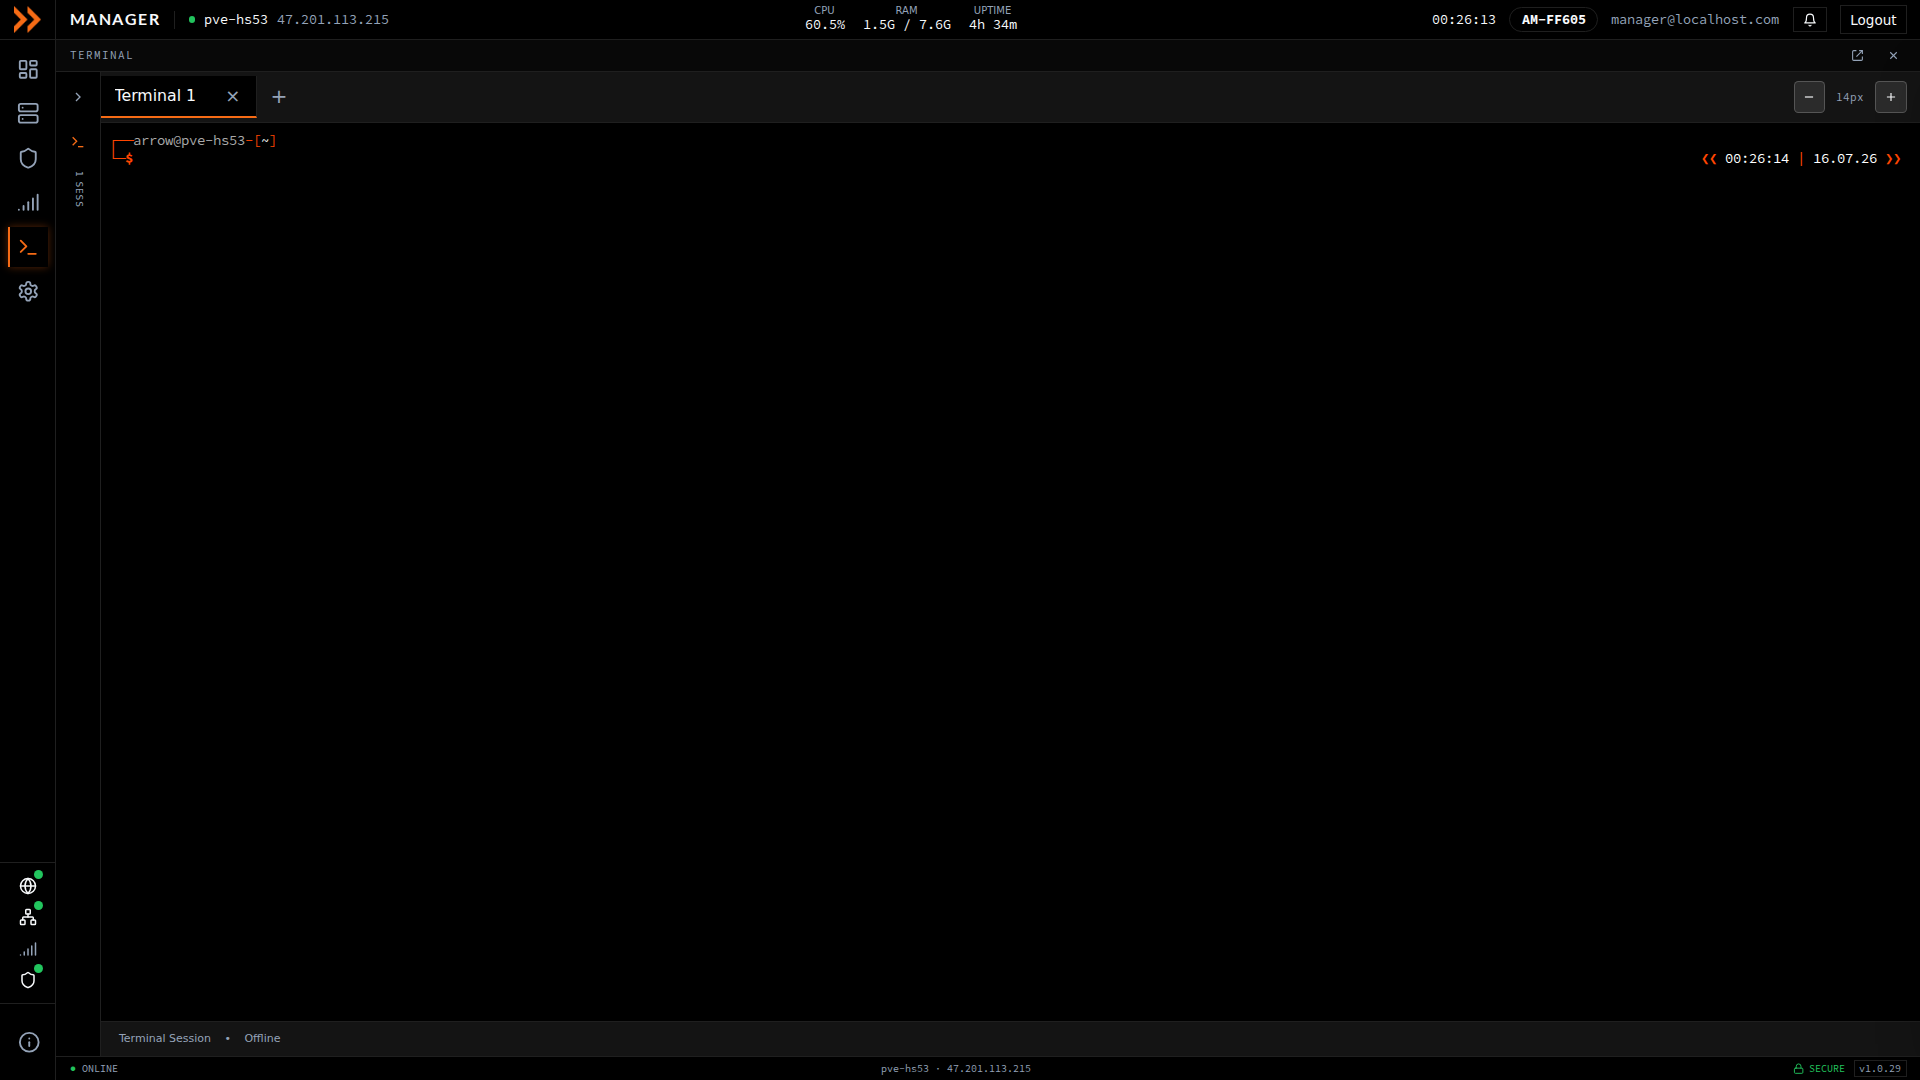
The built-in terminal, with tabbed sessions and adjustable font size
The built-in terminal, with tabbed sessions and adjustable font size
Display Options
Section titled “Display Options”ARROW Manager is built for a dark interface, and that is what you get out of the box. It works on both desktop and mobile browsers, so you can check on a device from a phone in the field.
Light mode still exists, but it is hidden. To bring it back, open Settings, choose Appearance, and turn on Enable light mode. That restores the light theme and puts the light and dark toggle back in the top bar. Turning it off again returns the interface to dark straight away, and most people should leave it off.
Getting Help
Section titled “Getting Help”If something is not working, the fastest fix is usually to confirm your own network or VPN connection to the device, since most problems are connectivity rather than the device itself. The Troubleshooting guide covers the common cases. If it persists, contact your administrator.
Related Documentation
Section titled “Related Documentation”- Authentication - How to log in
- Accessing ARROW Manager - Connection methods
- Deploying a VM - Run virtual machines on your device
- Software Updates - How updates reach your device
- Troubleshooting - Common issues and solutions