
Fleet Console
When a rig is not behaving, the Console screen lets you check on it without opening a separate SSH session. Pick a node, run a read-only diagnostic, and read the output in place. It is a fast way to confirm GPUs are visible, hashcat is healthy, and the host has room to work.
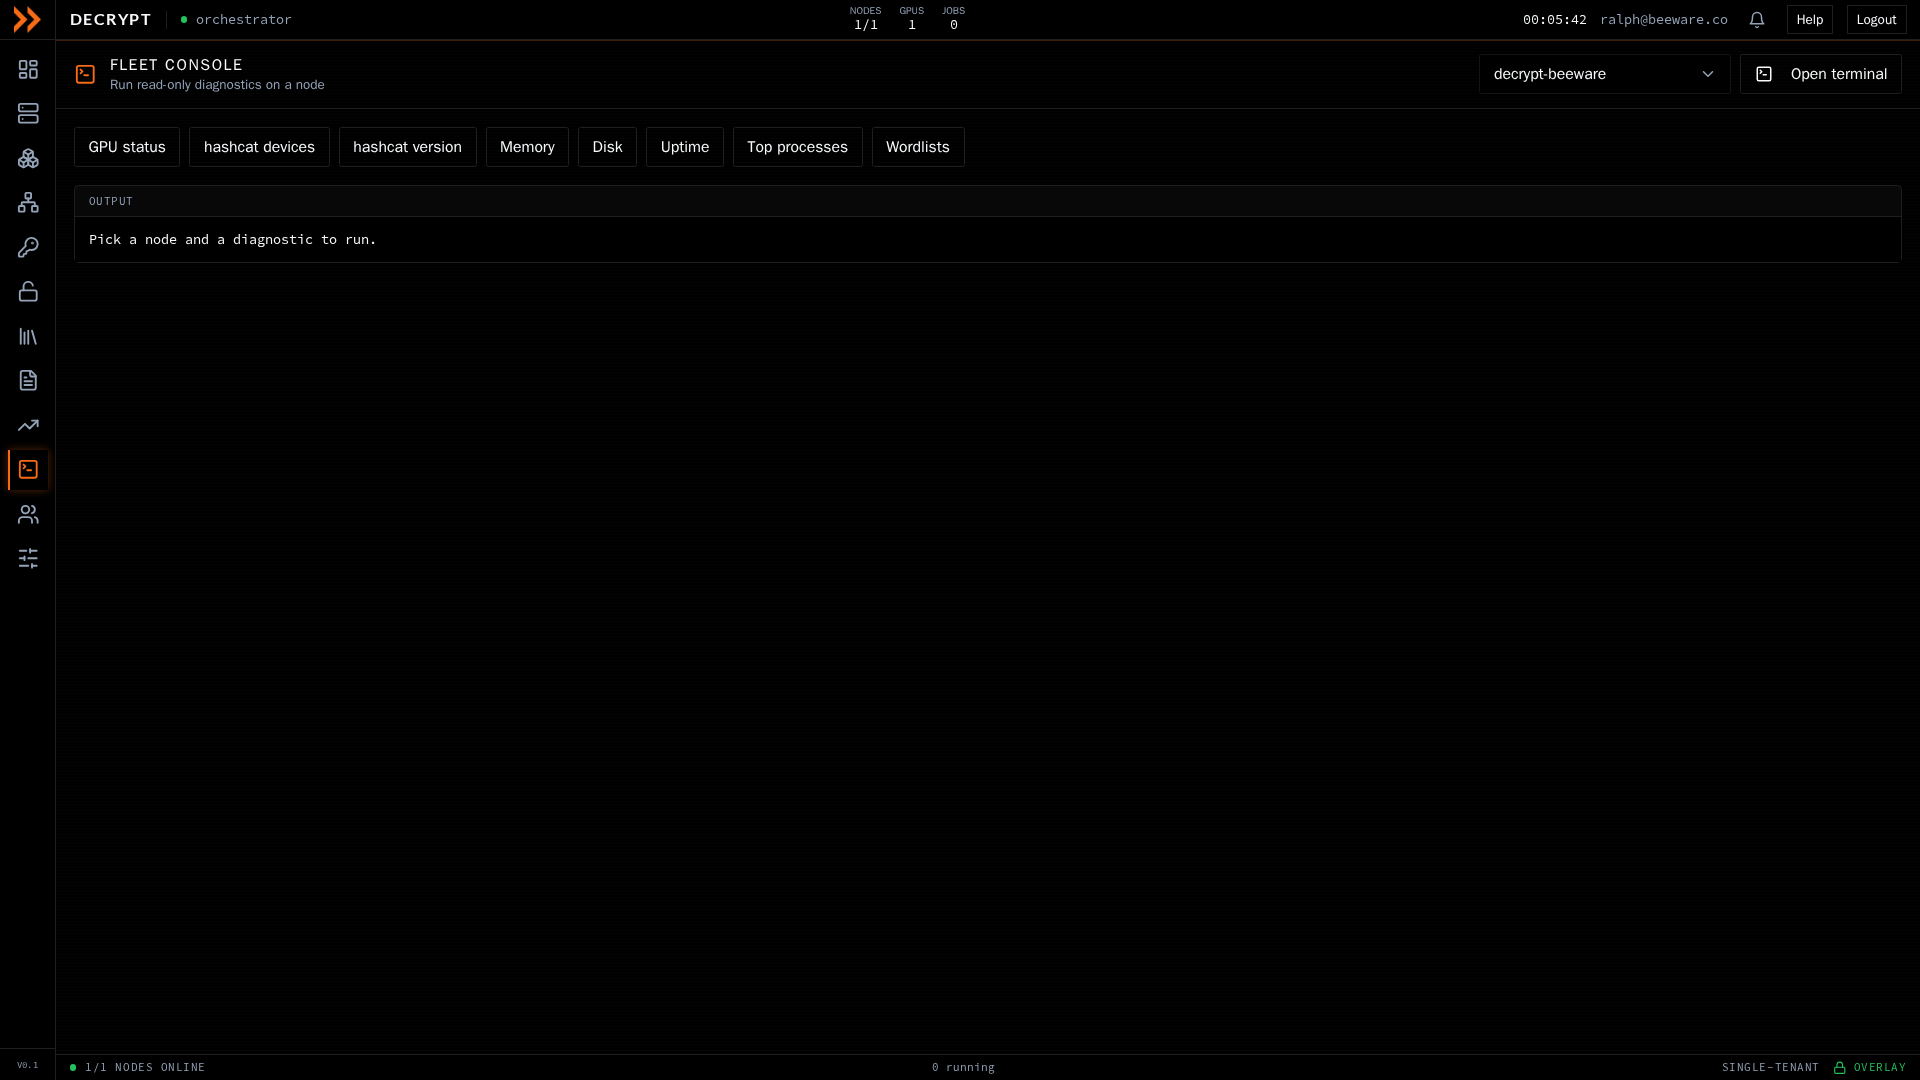
Run a read-only diagnostic on any node and read its output in place
Run a read-only diagnostic on any node and read its output in place
Running a diagnostic
Section titled “Running a diagnostic”- Choose a node from the dropdown at the top. The diagnostic buttons stay disabled until you do.
- Click one of the checks. The output appears in the pane below, labeled with the check you ran.
The available checks are all read-only and non-destructive:
| Check | What it reports |
|---|---|
| GPU status | The rig’s GPUs and their current state |
| hashcat devices | The devices hashcat can see |
| hashcat version | The installed hashcat version |
| Memory | Memory in use and free |
| Disk | Disk space on the host |
| Uptime | How long the host has been up |
| Top processes | The busiest processes right now |
| Wordlists | Which wordlists are present on the rig |
If the selected node cannot be reached, the pane shows that it is unreachable rather than stale data.
Opening a terminal
Section titled “Opening a terminal”For anything the fixed checks do not cover, click Open terminal to bring up an interactive shell on the selected node in a separate window. The window is titled with the node’s name so you always know which rig you are on.
Related documentation
Section titled “Related documentation”- GPU Nodes & Cluster - Live health for every rig
- Settings - Benchmark and manage the cluster