
System Monitoring
When a VM feels slow, a build stalls, or a scan seems to have run away with the machine, this is where you look first. System monitoring gives you a live read on CPU, memory, storage, and network, plus enough detail to tell whether the problem is one pegged core, a filesystem about to fill up, or a network link dropping packets, all without leaving the browser.
Opening it
Section titled “Opening it”- Sign into ARROW Control.
- Click Processes in the left rail.
- The System Utilization page opens with live data.
Along the top you see the hostname, uptime, and process count, and the controls for how the data refreshes. A Live indicator confirms the feed is active, a dropdown sets the refresh interval (for example every 5 seconds), and Refresh and Pause let you force an update or freeze the view while you read it.
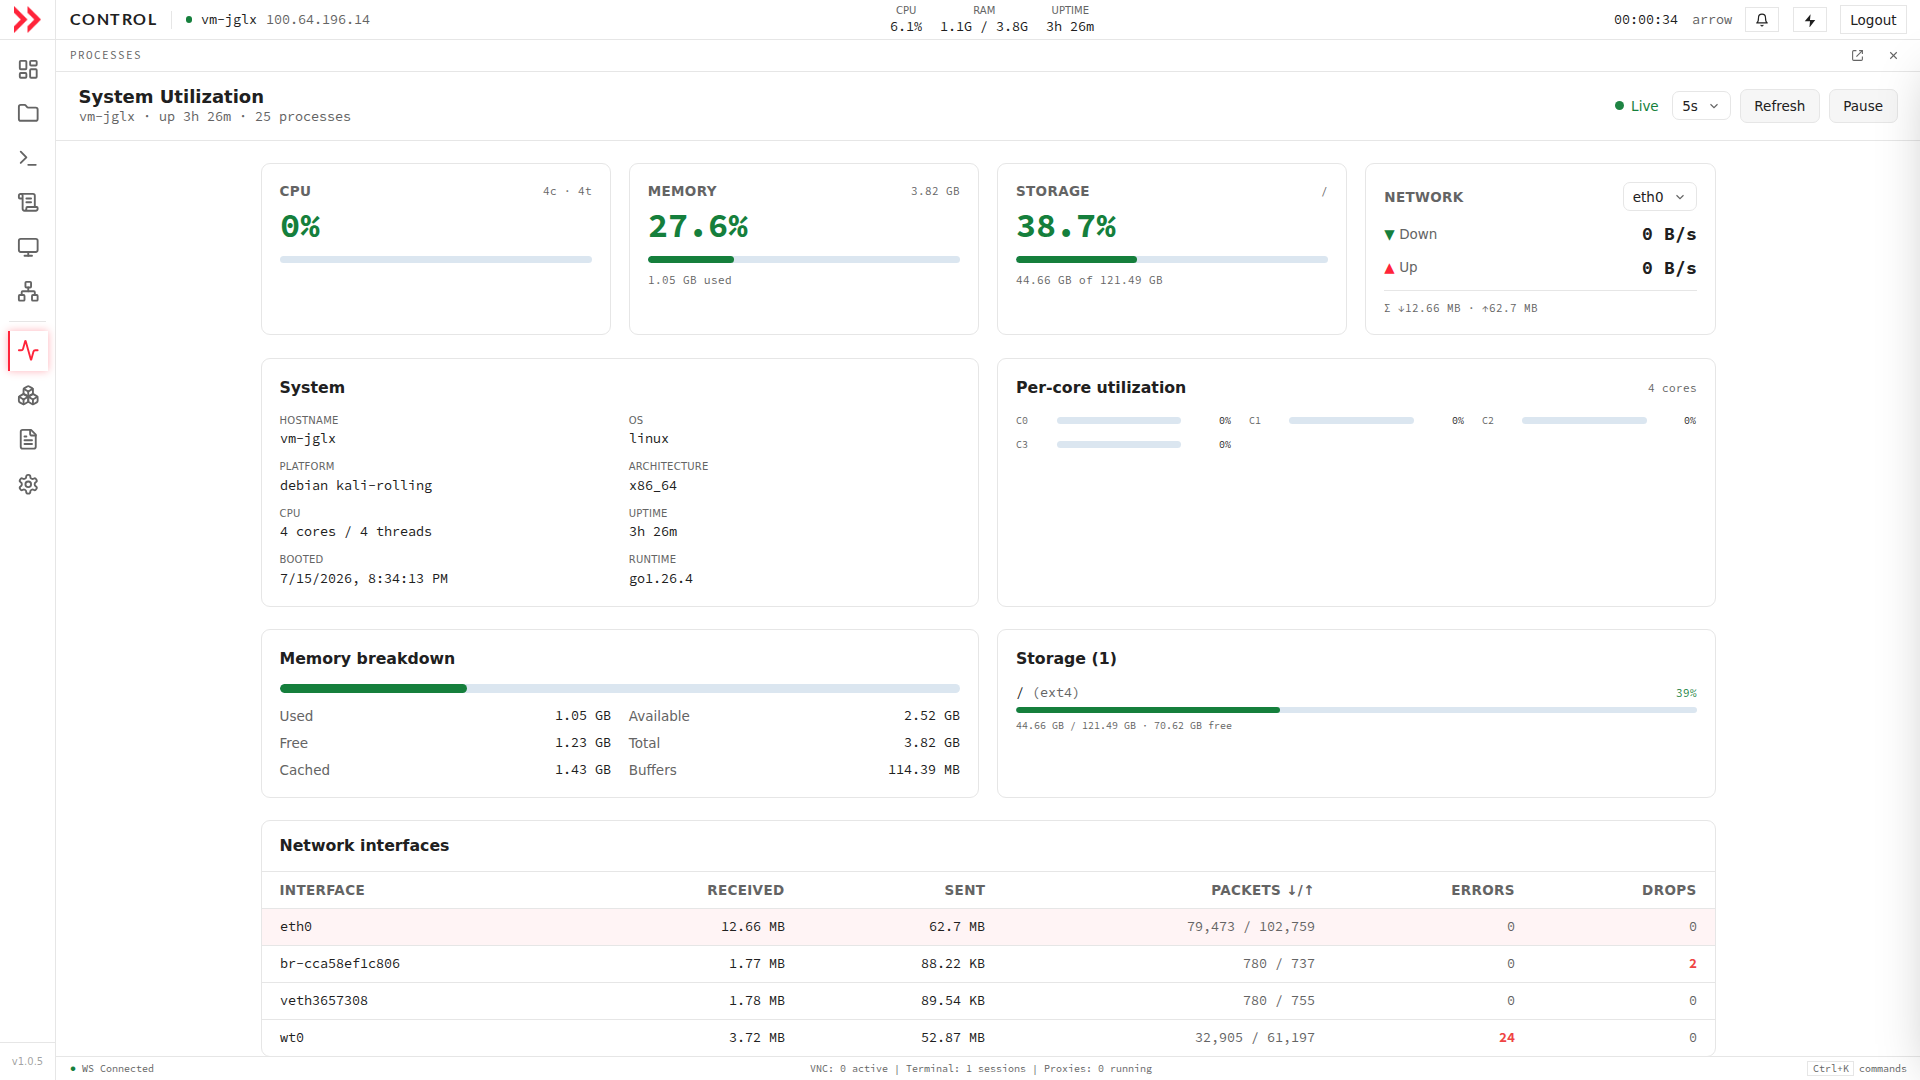
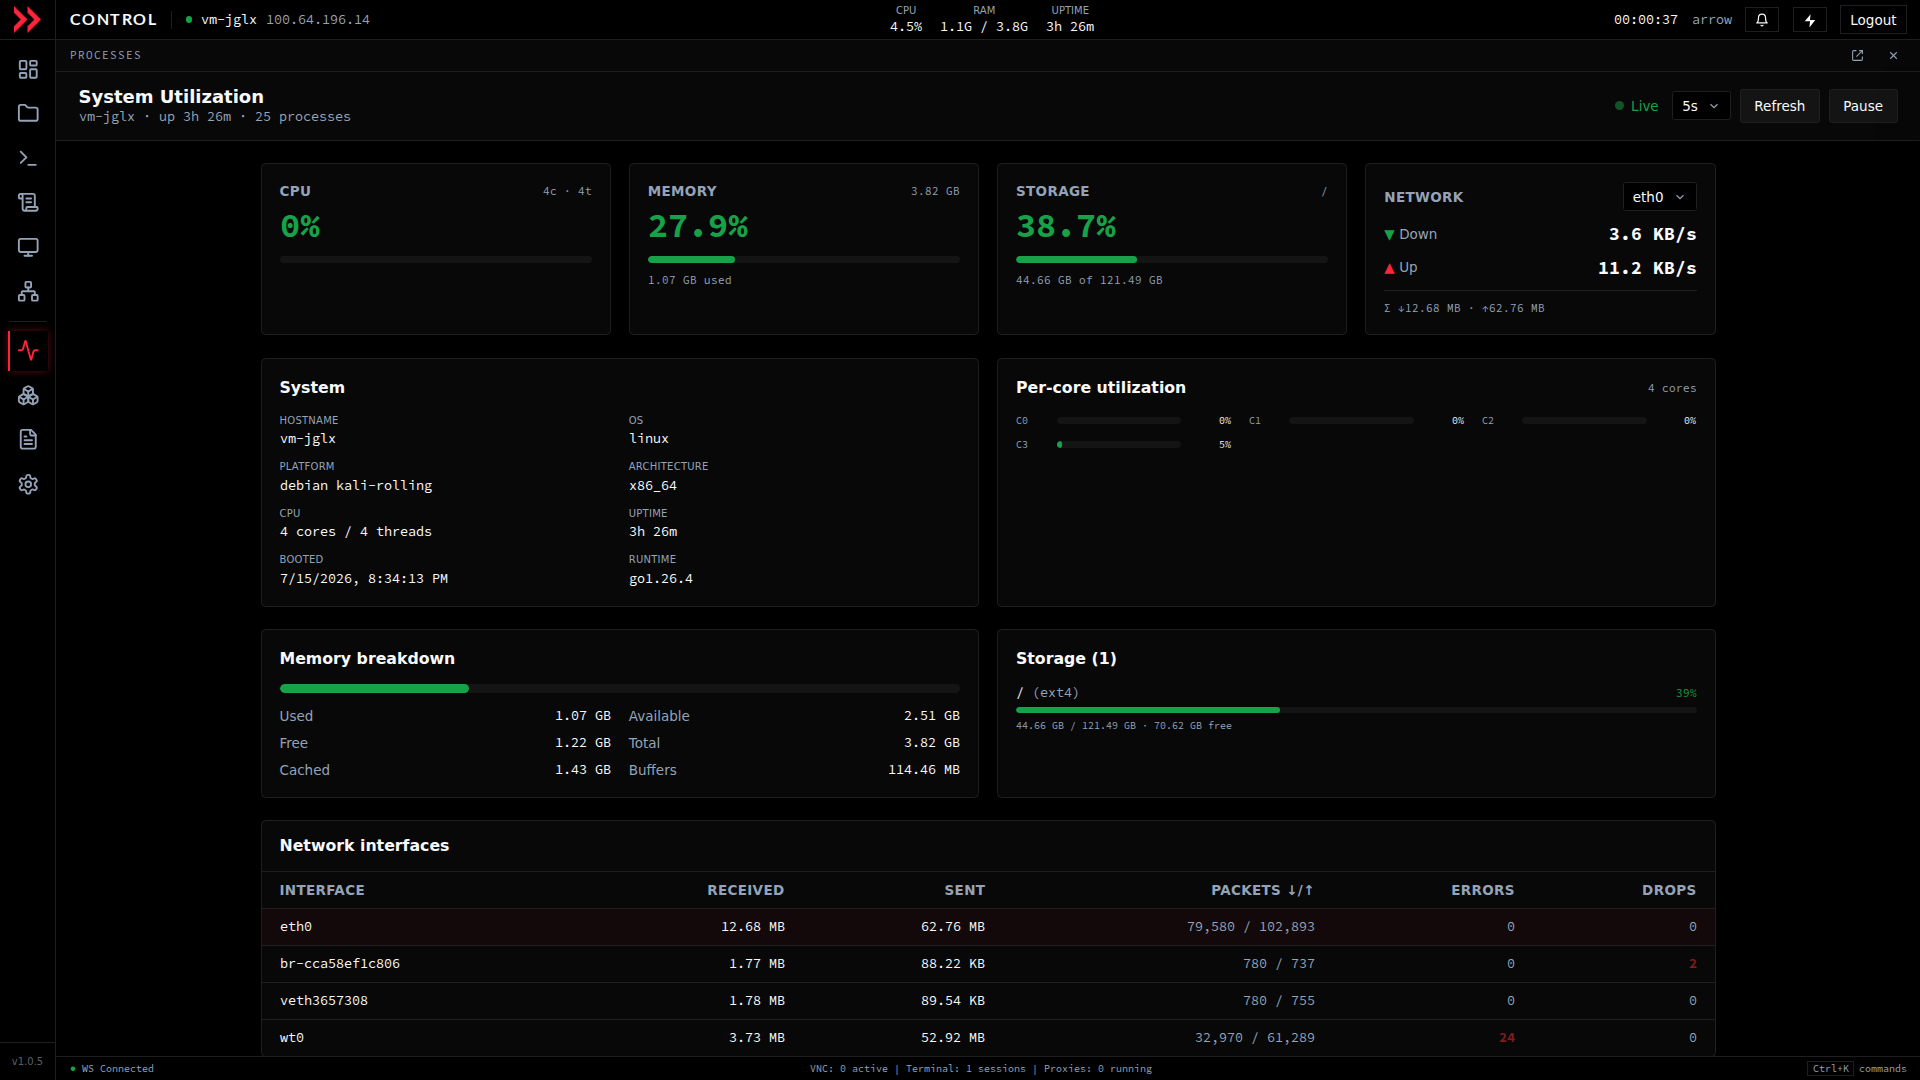
System Utilization shows live CPU, memory, storage, and network, plus per-core detail, a memory breakdown, and a network interface table.
System Utilization shows live CPU, memory, storage, and network, plus per-core detail, a memory breakdown, and a network interface table.
The at-a-glance cards
Section titled “The at-a-glance cards”Four cards across the top give you the whole VM in one look:
- CPU: current processor utilization, with the core and thread count in the corner (for example
4c 4t). - Memory: RAM usage as a percentage, with total capacity and the amount in use.
- Storage: disk usage for the root filesystem, used against total.
- Network: live download and upload rates for the selected interface, with cumulative totals. Switch interfaces with the dropdown in the corner.
They all update on the interval you chose.
Digging deeper
Section titled “Digging deeper”When the cards tell you something is off, the panels below tell you why.
System lists the basics about the box, including hostname, OS, distribution (for example debian kali-rolling), architecture (for example x86_64), core and thread count, uptime, boot time, and the ARROW Control runtime version. Handy when you need to confirm exactly what you are working on.
Per-core utilization breaks CPU load out to each core (C0, C1, C2, and so on). This is the panel that catches the case the CPU card can hide, a single-threaded process pinning one core to 100 percent while the overall percentage still looks calm.
Memory breakdown splits RAM into used, free, cached, available, total, and buffers. Cached memory is normal and managed automatically, so do not read it as pressure; watch used and available to judge real headroom.
Storage shows every mounted filesystem with its type (for example ext4), a fill bar, used against total, and free space. Keep an eye on the fill percentage, because once a filesystem passes roughly 90 percent, performance suffers and you should clean up or expand.
Network interfaces lists every interface with received and sent totals, packet counts, errors, and drops. On ARROW VMs you will usually see eth0 (the primary connection), wt0 (the Netbird VPN tunnel), and br-... or veth... (container and bridge interfaces). Climbing error or drop counts on an interface are a good hint that something is wrong with that link.
Processes
Section titled “Processes”The process count in the page header is your bridge from a metric spike to its cause. When you need to go further and actually inspect or kill something, open a terminal and reach for the standard tools, using top or htop to find the heavy hitters, and kill -15 to end a process gracefully before falling back to kill -9.
Reading the numbers
Section titled “Reading the numbers”As a rough sense of what is fine versus worth a look:
| Metric | Normal | Keep an eye on | Act |
|---|---|---|---|
| CPU | 0-70% | 70-85% sustained | >85% sustained |
| Memory | 0-75% | 75-90% | >90% |
| Storage | 0-80% | 80-90% | >90% |
The shape of the change matters too. A sudden spike usually means a runaway process, a slow climb usually means a growing workload, and a repeating pattern often lines up with a scheduled task.
Tracing it back in the audit log
Section titled “Tracing it back in the audit log”Monitoring shows you how the VM is doing right now; the Audit Logs section shows you what has happened over time, which is how you connect a spike to whatever triggered it. Open Audit Logs in the left rail for a searchable, timestamped record of actions, sessions, and connections. You can search by action, user, IP, resource, or details, filter down to the event types you care about, and export the results to CSV for compliance or offline review.
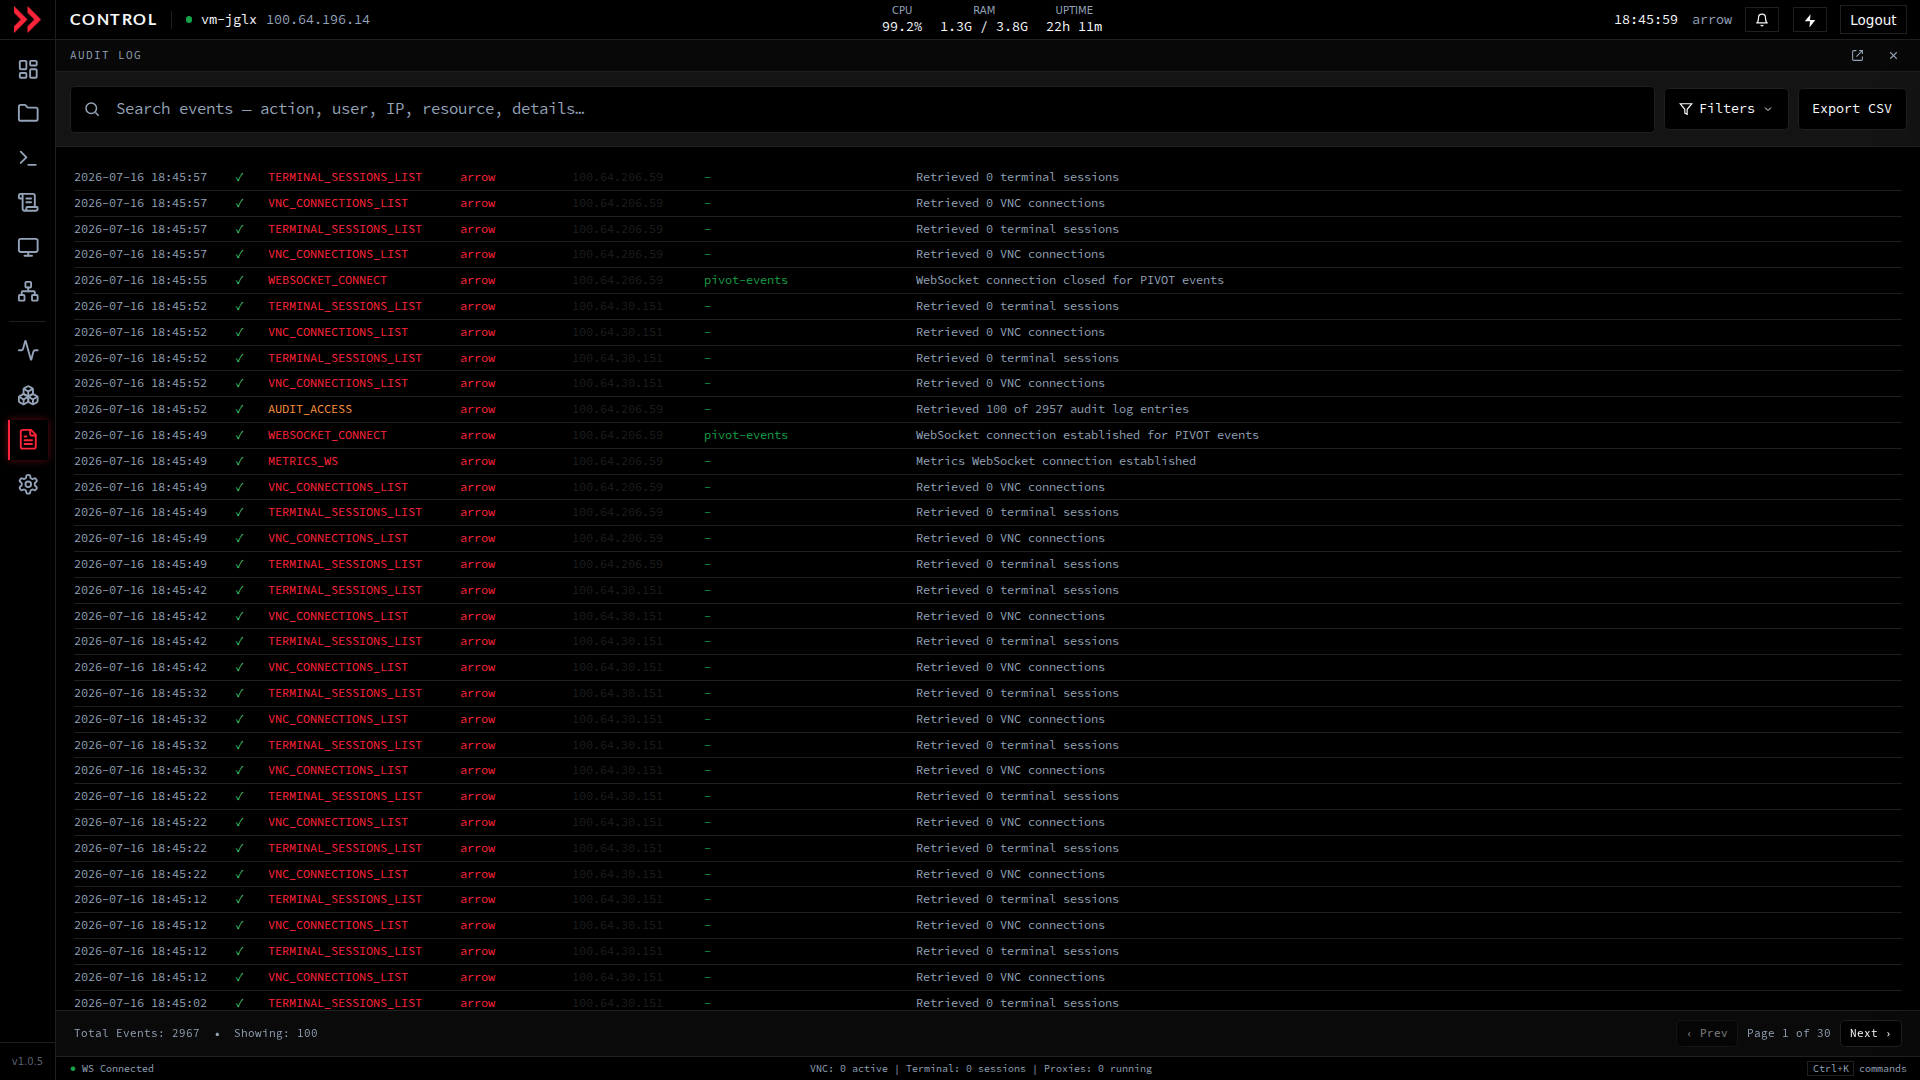
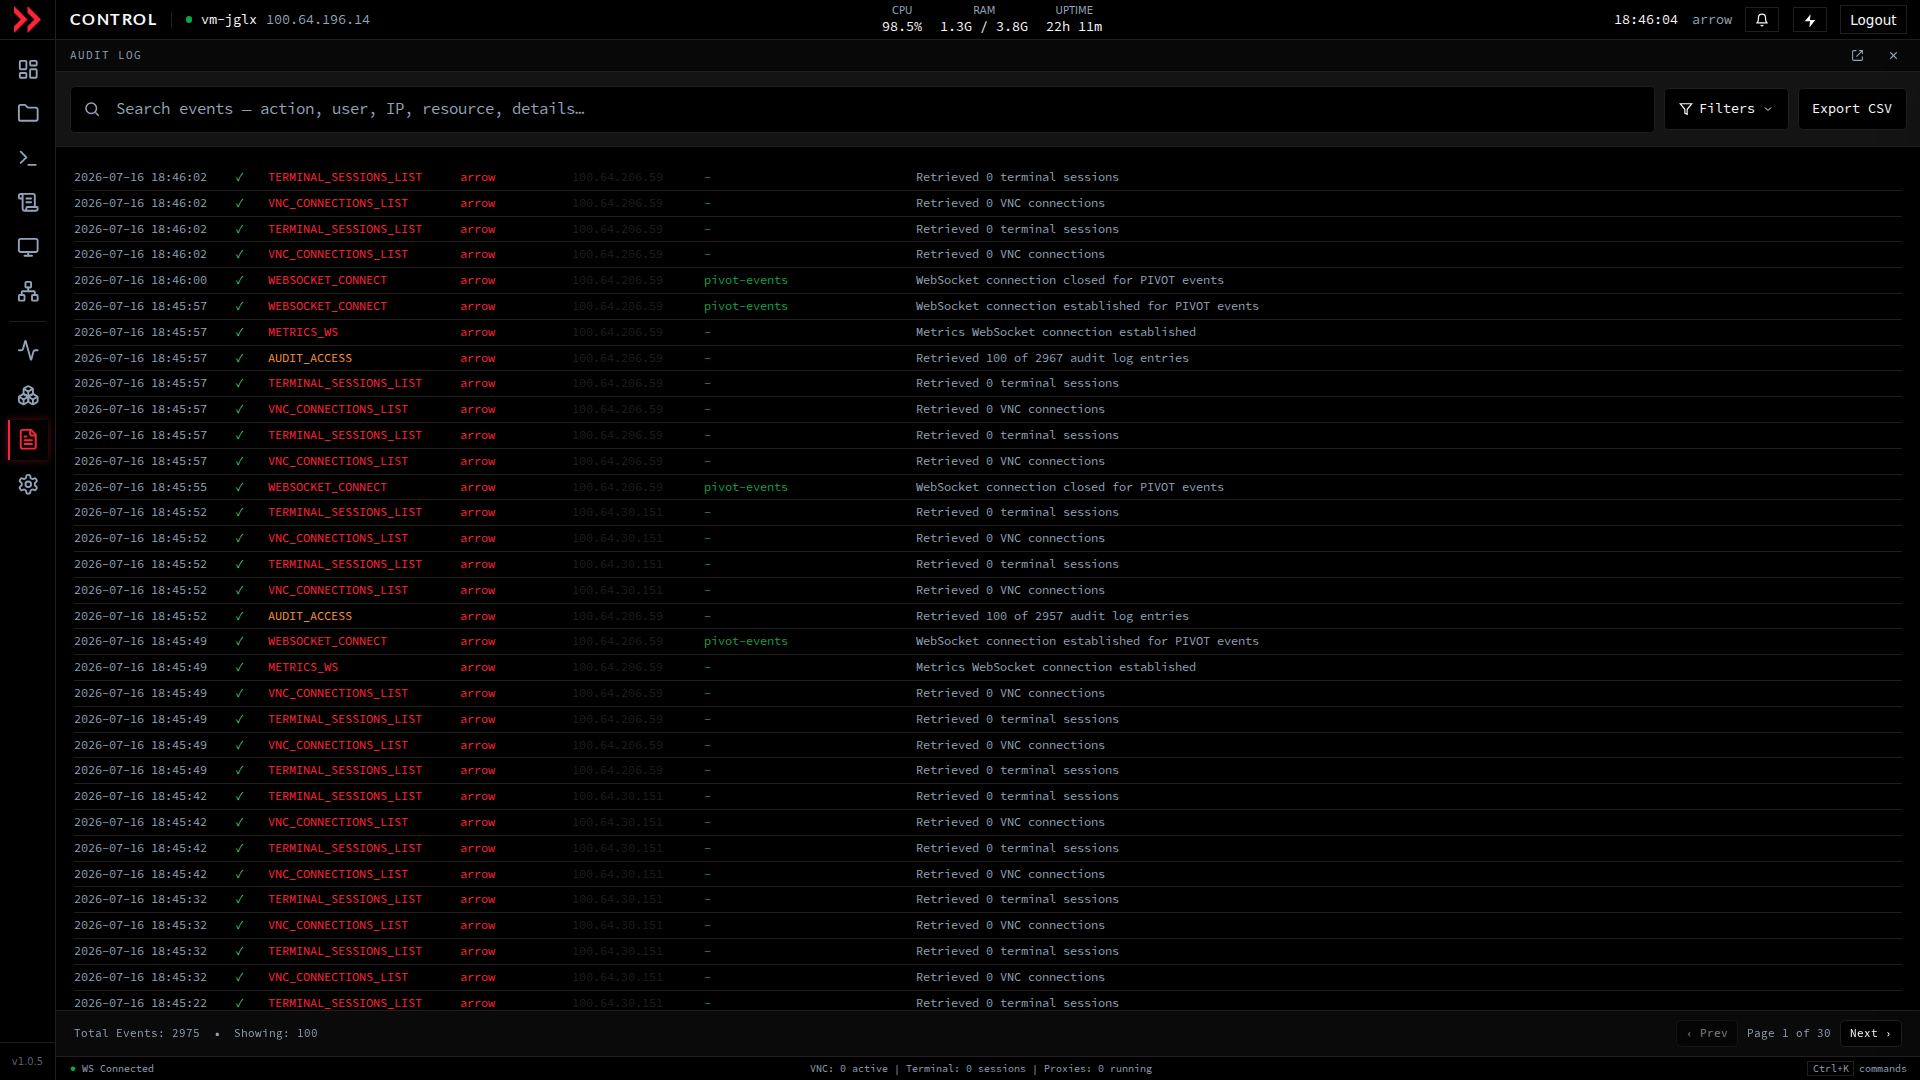
The audit log records every action, session, and connection, with search, filters, and CSV export.
The audit log records every action, session, and connection, with search, filters, and CSV export.
Narrowing it down with the filters
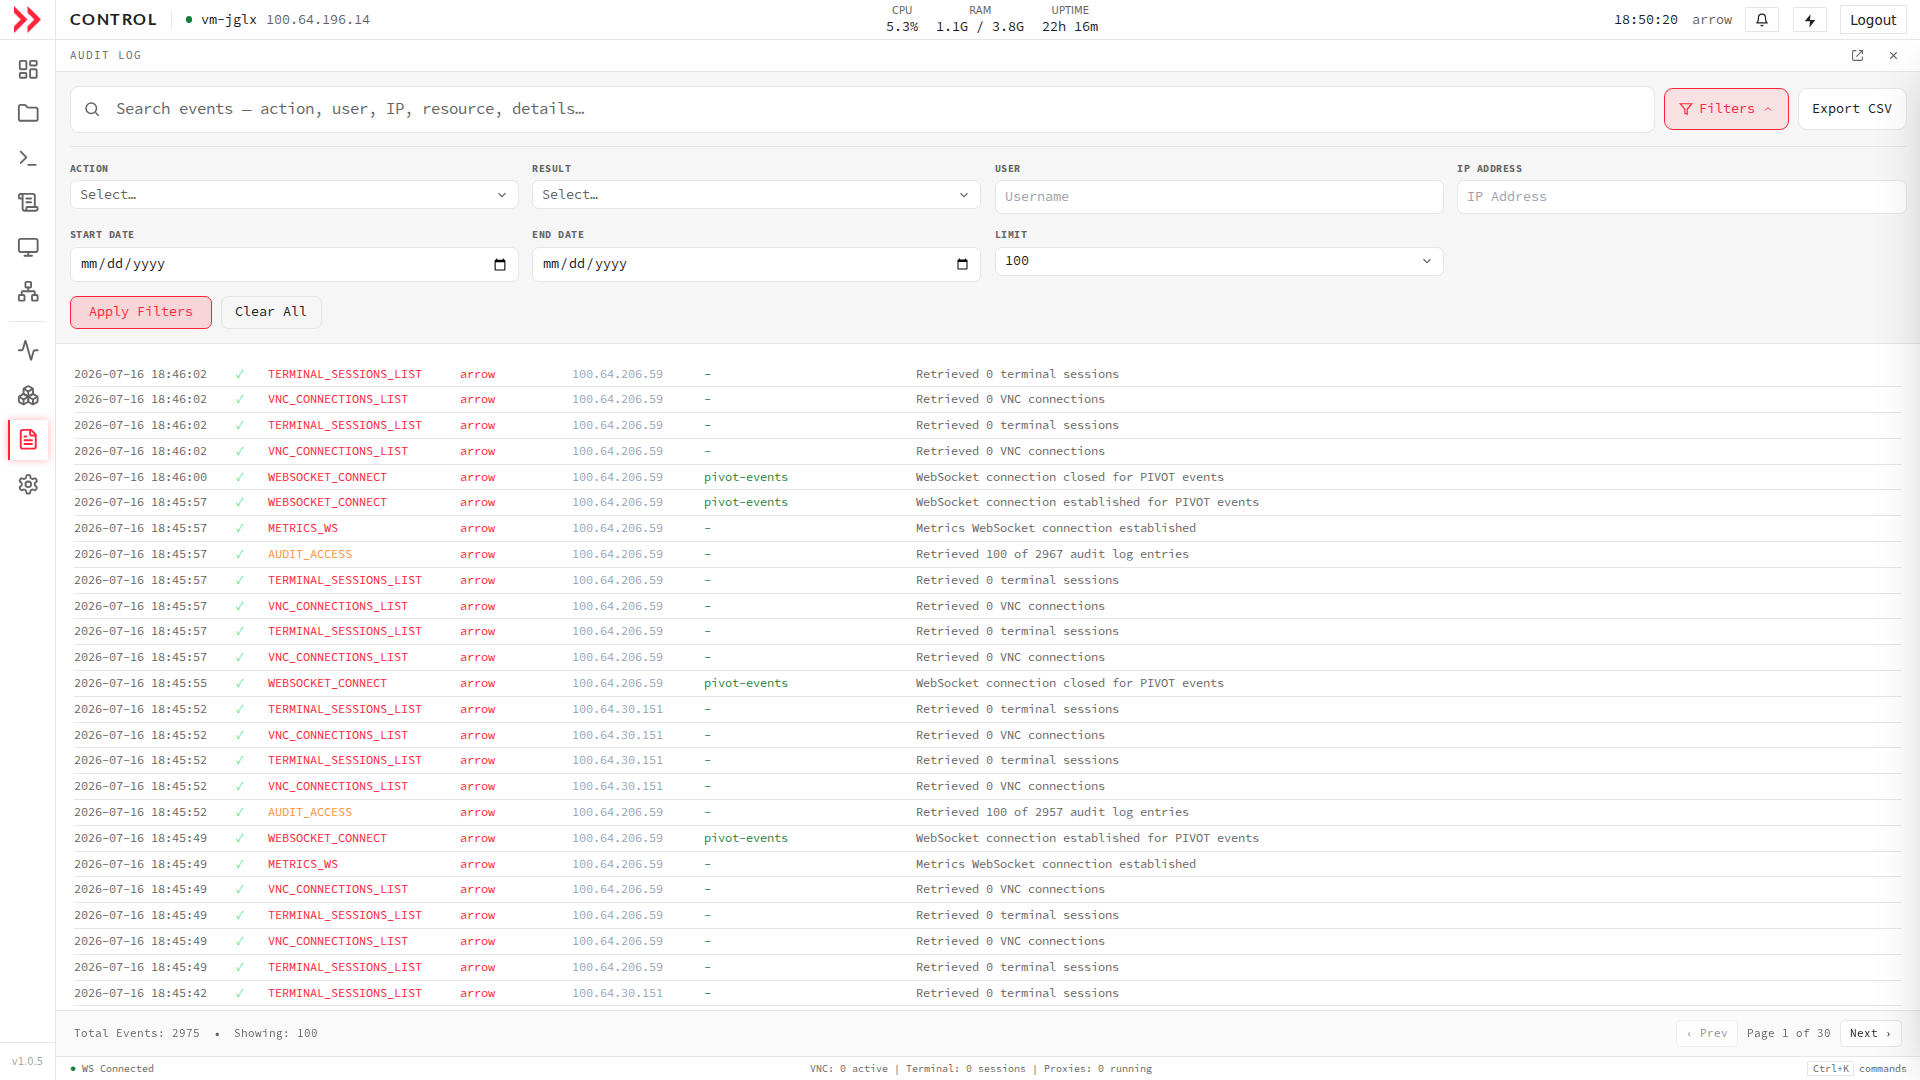
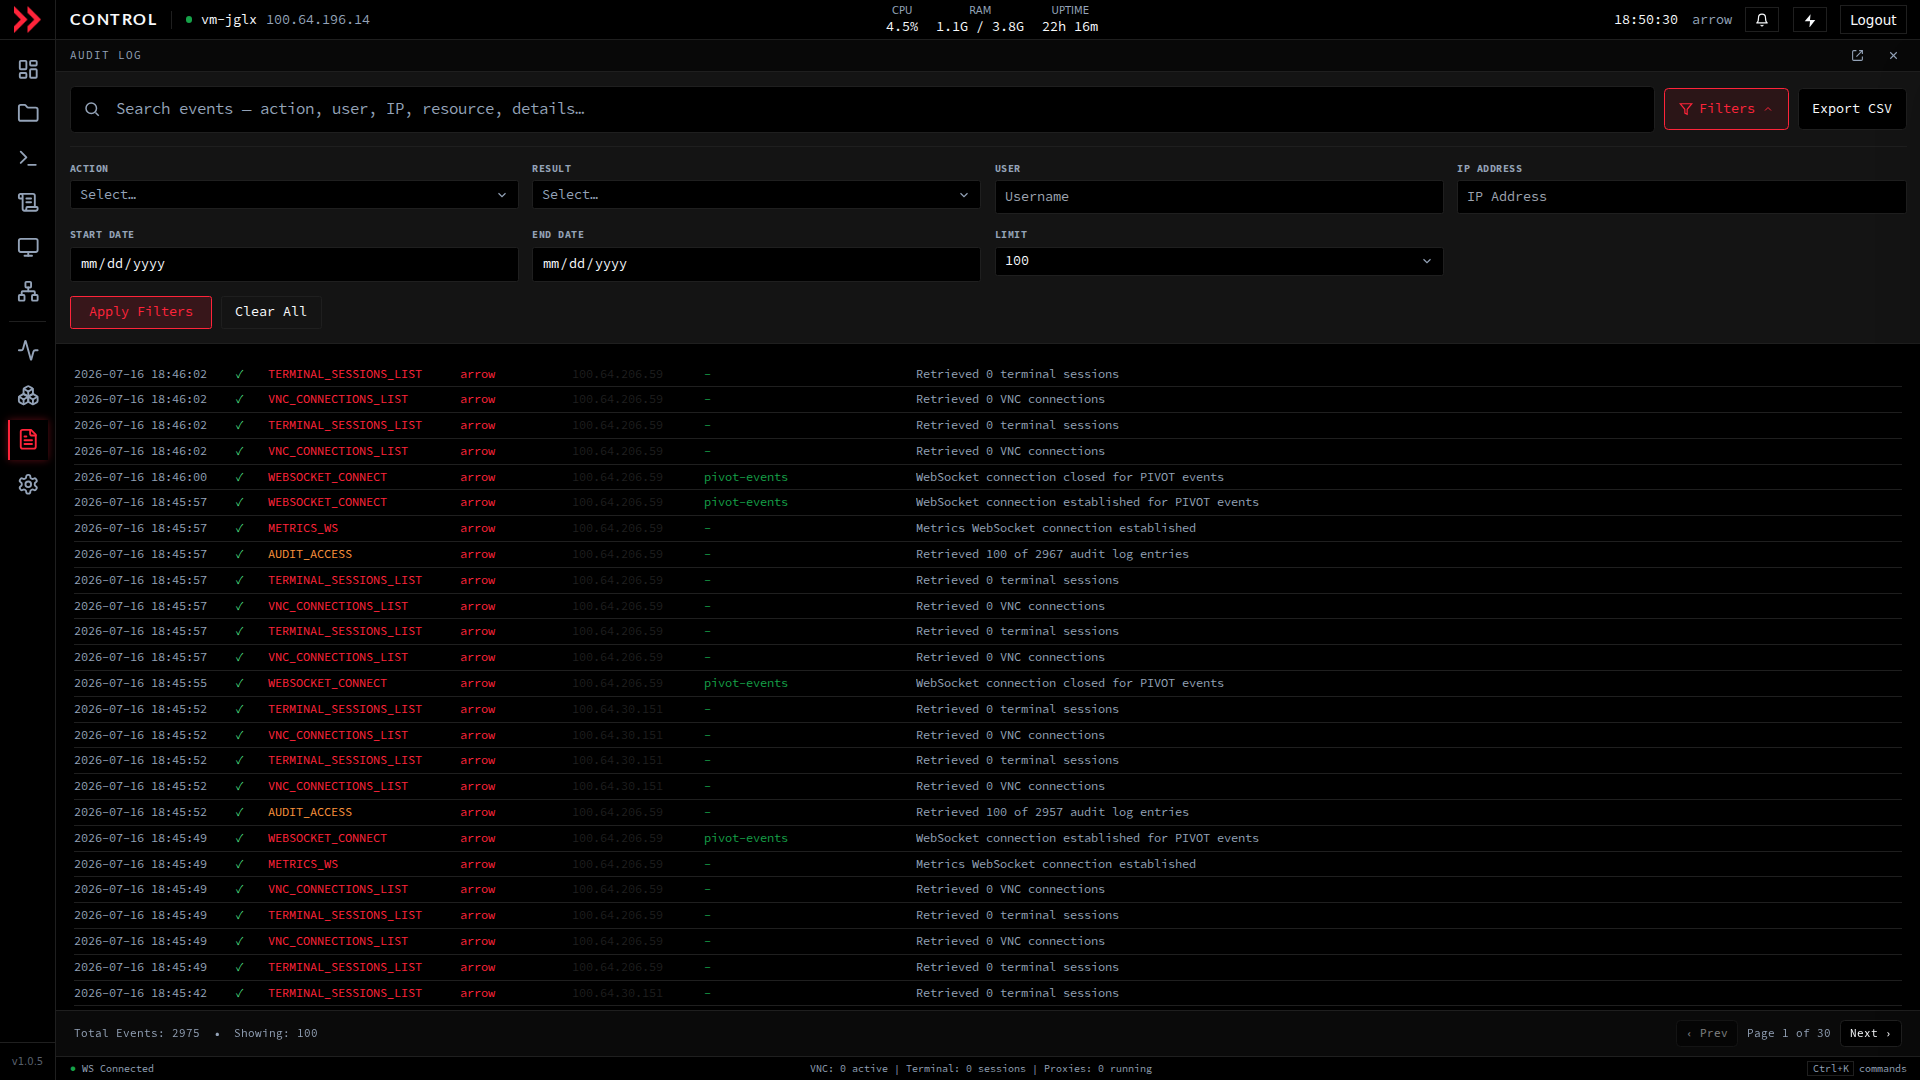
Section titled “Narrowing it down with the filters”The search box handles quick lookups, but when you need to answer a precise question, such as who connected from a given IP last Tuesday, click Filters to open the filter panel. It gives you a set of fields you can combine:
- Action: limit to a single event type, for example a login, a terminal session, or a connection.
- Result: keep only successes or only failures, which is the fast way to surface things that were denied or errored.
- User: scope the log to one operator.
- IP address: scope to a single source address.
- Start date and End date: bound the results to the window you care about.
- Limit: cap how many rows come back.
Set what you need and click Apply Filters; Clear All resets them. When the view shows exactly the events you want, Export CSV writes them out for an evidence pack, a compliance record, or offline review.
The Filters panel narrows the audit log by action, result, user, IP, and date range, with a row limit and Export CSV.
The Filters panel narrows the audit log by action, result, user, IP, and date range, with a row limit and Export CSV.
The point of all this is accountability. The audit log is a complete, timestamped record of who did what on the device, and the filters plus CSV export turn that record into something you can hand over as evidence or keep for your own files.
Troubleshooting
Section titled “Troubleshooting”| What you see | What to try |
|---|---|
| High CPU | Check the per-core panel to see whether it is one core or spread out, then open a terminal and use top or htop to find the top consumers. |
| Memory pressure | Watch the memory breakdown for shrinking available memory, and check long-running processes for leaks. |
| Storage warning | Read the storage fill bars, clear logs in /var/log, and remove unused files. |
| Network issues | Check the received and sent totals and the error and drop counts, and confirm the VPN tunnel (wt0) is active. |
A few good habits
Section titled “A few good habits”Glance at the metrics now and then, not just when something breaks, so you learn what normal looks like for your workload and unusual spikes stand out. Try to keep storage under 80 percent to leave room for logs and temporary files, and when a resource spikes, use the audit log to tie it back to recent activity.
Related Documentation
Section titled “Related Documentation”- ARROW Control Overview - Complete feature overview
- Terminal & VNC Access - Command-line access for deeper diagnostics
- Troubleshooting - General troubleshooting guide